Apache POI Word - Bar Chart
Overview
This article introduces how to use Apache POI to generate a bar chart in a Word document. The document format requirement is docx, which corresponds to XWPFDocument in Apache POI. The source code will be provided at the end of the article.
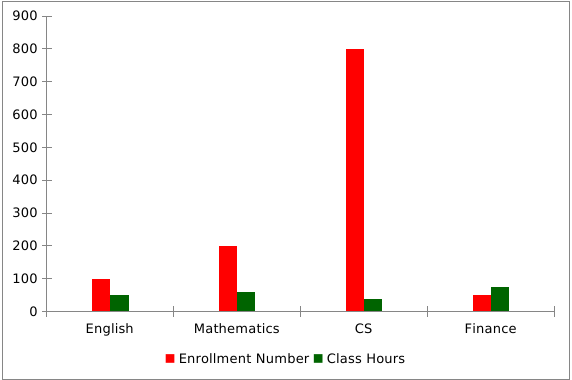
The final bar chart to be implemented
Before we start, let's first showcase the desired outcome. Our goal is to create a bar chart as shown below:

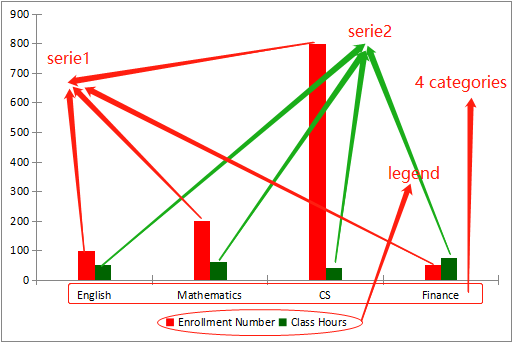
To help you better understand this chart and the subsequent code, let's break down the elements in the chart:

From the figure above, we can see the following elements, all of which will be reflected in the subsequent code:
- The first element is the categories: English, Mathematics, Computer Science, and Finance.
- The second element is the series: There are two series. The first series represents the number of students enrolled, and the second series represents the number of hours for each course.
- The third element is the legend, which allows us to easily distinguish between the two series. The first series is represented by red bars, and the second series is represented by green bars.
Prepare the data containers
Java implementation of bar chart
1、Prepare the data models
Before we begin, we provide several utility classes: ChartData/SerieData is used to store the data for the bar chart, and BarChartRenderer is used to render the bar chart. You can refer to the complete code later to see the details. Due to space limitations, getter and setter methods are omitted here:
public class ChartData {
  // chart title
  private String title;
  private List<String> categories;
  private List<SerieData> series;
}
public class SerieData {
  // serie name
  private String name;
  // serie data
  private List<Number> data;
  // serie color
  private PresetColor color = PresetColor.ALICE_BLUE;
}

public class BarChartRenderer {
  public void render(XWPFDocument document, ChartData chartData) throws IOException, InvalidFormatException {
    // The implementation is divided into the following code snippets, covering sections 2-5, with section 6 being the main method that showcases its usage:
  }
}
The code is broken down into small pieces for easier explanation. The complete code can be found on GitHub.
2、Create chart and axes
XWPFChart chart = document.createChart(14 * Units.EMU_PER_CENTIMETER, 10 * Units.EMU_PER_CENTIMETER);
XDDFCategoryAxis xAxis = chart.createCategoryAxis(AxisPosition.BOTTOM);
XDDFValueAxis yAxis = chart.createValueAxis(AxisPosition.LEFT);
yAxis.setCrosses(AxisCrosses.AUTO_ZERO);
yAxis.setCrossBetween(AxisCrossBetween.BETWEEN);
3、Create data source
// construct category data source
String[] categories = chartData.getCategories().toArray(new String[0]);
XDDFDataSource<String> categoryDS = XDDFDataSourcesFactory.fromArray(categories);
// construct series data source
List<XDDFNumericalDataSource<Number>> valueDS = new ArrayList<>();
List<SerieData> seriesData = chartData.getSeries();
for (SerieData seriesDatum : seriesData) {
  XDDFNumericalDataSource<Number> s = XDDFDataSourcesFactory.fromArray(seriesDatum.getData().toArray(new Number[0]));
  valueDS.add(s);
}
In constructing the series data source, a for loop is used because there can be any number of series. Although we only have two series here (enrollment number and class hours), you can add more if needed.
4、Bind the data source to the chart
XDDFChartData data = chart.createData(ChartTypes.BAR, xAxis, yAxis);
// Control the orientation of the bars, they can be either vertical or horizontal, in this case it is vertical
((XDDFBarChartData) data).setBarDirection(BarDirection.COL);
// This controls the width of the bars, with larger values resulting in thinner bars.
((XDDFBarChartData) data).setGapWidth(500);
// If there is only one series, then setVaryColors(false); otherwise, each bar will have a different color.
data.setVaryColors(seriesData.size() > 1);

int i = 0;
for (XDDFNumericalDataSource<Number> value : valueDS) {
    XDDFChartData.Series series = data.addSeries(categoryDS, value);
    // Set the name of the series, the series name will be displayed in the legend.
    series.setTitle(seriesData.get(i).getName(), null);
    // Settings specific to LibreOffice, otherwise it may not display properly in LibreOffice.
    solidFillSeries(series, seriesData.get(i).getColor());
    i++;
}

private static void solidFillSeries(XDDFChartData.Series series, PresetColor color) {
  XDDFSolidFillProperties fill = new XDDFSolidFillProperties(XDDFColor.from(color));
  XDDFShapeProperties properties = series.getShapeProperties();
  if (properties == null) {
      properties = new XDDFShapeProperties();
  }
  properties.setFillProperties(fill);
  series.setShapeProperties(properties);
}
5、Set the legend and draw the chart
XDDFChartLegend legend = chart.getOrAddLegend();
// The legend is displayed below the chart
legend.setPosition(LegendPosition.BOTTOM);
legend.setOverlay(false);
// draw the chart
chart.plot(data);
6、Save the chart to a docx file
In BarChartRenderer, add a main method to prepare the chart data, call the render method to draw the chart, and finally save the chart to the XWPF document.
ChartData chartData = new ChartData();
chartData.setTitle("Enrollment");
chartData.setCategories(Arrays.asList("English", "Mathmatics", "CS", "Finance"));

List<SerieData> seriesData = new ArrayList<>();
seriesData.add(createSerieData("Enrollment Number", Arrays.asList(100, 200, 800, 50), PresetColor.RED));
seriesData.add(createSerieData("Class Hours", Arrays.asList(50, 60, 40, 75), PresetColor.DARK_GREEN));
chartData.setSeries(seriesData);

XWPFDocument document = new XWPFDocument();
new BarChartRenderer().render(document, chartData);
try (FileOutputStream fo = new FileOutputStream("D:\\bar.docx")) {
    document.write(fo);
}
Maven dependencies
<dependency>
    <groupId>org.apache.poi</groupId>
    <artifactId>poi-ooxml</artifactId>
    <version>5.2.3</version>
</dependency>
<dependency>
    <groupId>org.apache.poi</groupId>
    <artifactId>poi-ooxml-full</artifactId>
    <version>5.2.3</version>
</dependency>
Note that the dependencies required may vary depending on the version of POI. This is explained in the article "Apache POI Pie Chart Java Implementation" so I won't go into detail here.
Notice:Feedback requires logging into the system first.


