Apache POI Word - Line Chart
Overview
This article will provide an introduction to generating a line chart using Apache POI's XWPF API. The document format required is docx, which corresponds to XWPFDocument in Apache POI.
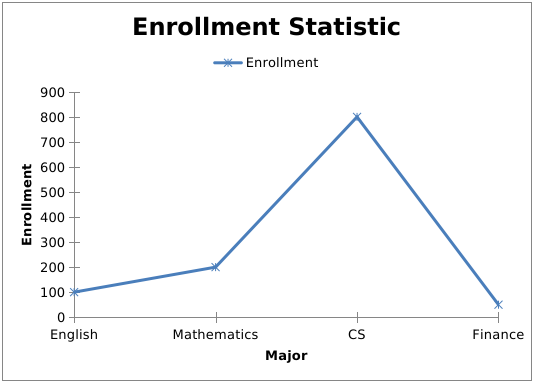
The final line chart we will plot

Since the approach to generate a line chart using Apache POI is almost identical to that of a bar chart, this article will not explain it in details. Instead, the code will be directly provided with comments. If you find it challenging to understand, you can refer to Apache POI Word - Bar Chart first.
Generating a line chart using the POI XWPF API
You can get source code from Github
package net.verytools.prac;

import org.apache.poi.openxml4j.exceptions.InvalidFormatException;
import org.apache.poi.util.Units;
import org.apache.poi.xddf.usermodel.chart.*;
import org.apache.poi.xwpf.usermodel.XWPFChart;
import org.apache.poi.xwpf.usermodel.XWPFDocument;

import java.io.FileOutputStream;
import java.io.IOException;

public class LineChartRenderer {

  public void render(XWPFDocument doc) throws IOException, InvalidFormatException {
    // Create a chart
    XWPFChart chart = doc.createChart(14 * Units.EMU_PER_CENTIMETER, 10 * Units.EMU_PER_CENTIMETER);
    chart.setTitleText("Enrollment Statistic");
    chart.setTitleOverlay(false);
    // Set legend position
    XDDFChartLegend legend = chart.getOrAddLegend();
    legend.setPosition(LegendPosition.TOP);
    // x-axis position
    XDDFCategoryAxis xAxis = chart.createCategoryAxis(AxisPosition.BOTTOM);
    xAxis.setTitle("Major");
    // y-axis position
    XDDFValueAxis yAxis = chart.createValueAxis(AxisPosition.LEFT);
    yAxis.setTitle("Enrollment");

    // The category datasource and value data source
    XDDFCategoryDataSource categoryDS = XDDFDataSourcesFactory.fromArray(new String[]{"English", "Mathematics", "CS", "Finance"});
    XDDFNumericalDataSource<Integer> valueDs = XDDFDataSourcesFactory.fromArray(new Integer[]{100, 200, 800, 50});
    XDDFLineChartData data = (XDDFLineChartData) chart.createData(ChartTypes.LINE, xAxis, yAxis);
    // Binding the data source to the chart allows for creating multiple series, which enables the creation of multiple lines on the chart.
    XDDFLineChartData.Series series1 = (XDDFLineChartData.Series) data.addSeries(categoryDS, valueDs);

    series1.setTitle("Enrollment", null);
    series1.setSmooth(false);
    series1.setMarkerSize((short) 6);
    series1.setMarkerStyle(MarkerStyle.STAR);
    chart.plot(data);
    // Write the output to a file
    try (FileOutputStream fo = new FileOutputStream("D:\\line.docx")) {
        doc.write(fo);
    }
  }

  public static void main(String[] args) throws IOException, InvalidFormatException {
    new LineChartRenderer().render(new XWPFDocument());
  }

}
By comparing the above chart, it is believed that understanding this code should not be a problem. Finally, it should be noted that this article uses Apache POI version 5.2.3. Different versions may require different dependencies, so special attention is needed. To use POI for charting, it is crucial to understand concepts such as legends, series, categories, and data sources. These concepts have already been explained in detail in the dedicated section on Apache Word POI - Bar Chart, so they will not be reiterated here.
Maven dependencies
<dependency>
    <groupId>org.apache.poi</groupId>
    <artifactId>poi-ooxml</artifactId>
    <version>5.2.3</version>
</dependency>
<dependency>
    <groupId>org.apache.poi</groupId>
    <artifactId>poi-ooxml-full</artifactId>
    <version>5.2.3</version>
</dependency>
Summary
In the previous articles, we explained how to dynamically generate charts in a Word document: pie chart, bar chart, and line chart. Regardless of the chart type, the drawing process is quite similar, and can be considered a standardized approach. However, charts created using Apache POI may not display correctly in LibreOffice and may require specific handling. An example of this was discussed in the context of the bar chart.
Notice:Feedback requires logging into the system first.


